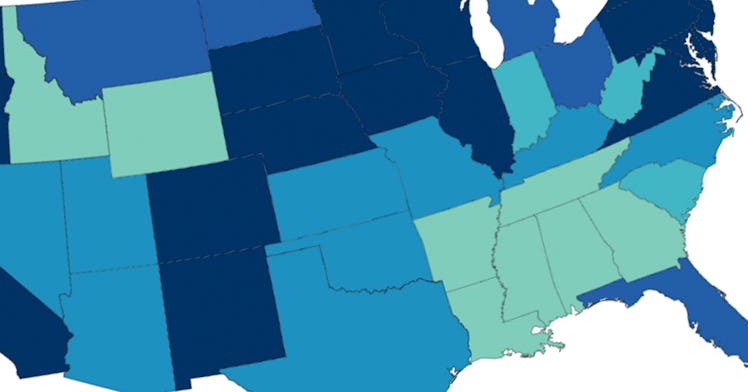
Map of Vaccine Rates in States Reveal Massive Politics Problem
The 2020 electoral college map, and the map of the rate of vaccination in the United States, are basically the same thing.

After a roaring ramp-up of vaccine distribution and production across the United States when President Biden came into office, the vaccine distribution has slowed down across the country. This is partly because the most enthusiastic of those who would receive vaccines have already done so, and the next phase of getting vaccines into people’s arms will require outreach to those who are hesitant to get the lifesaving jab.
Biden’s own July 4 plan has had to shift dramatically due to this reality. Hopefully, new population groups becoming eligible, like 12 to 15-year-olds, will make a difference.
Nevertheless, as of earlier this week, nearly half of Americans have received at least one dose of the COVID vaccine. But that statistic obscures a basic fact: that the rate of people who are vaccinated varies widely state by state.
And a new map shows that vaccination rates look a lot like the electoral map. States that went blue tend to have higher vaccination rates, and states that went red? Not so much.
And while there’s much more at play — age, race, education levels, etc, access disparity, people taking advantage of those in need, even disparities between localities in states — the correlation between political leanings of a state and vaccine rates is pretty clear.
Eric Levenson, a news writer for CNN, tweeted a map of the state vaccination rates and noted that the rates of vaccination in each state “closely fit the Trump-Biden electoral map,” with Georgia as the exception to the rule.
CDC
What States Are Excelling at Vaccinating People?
A more detailed map on CNN, and thorough analysis, shows that Vermont has the highest rate of vaccination — with 62 percent of the population having received at least one dose of the vaccine. In Massachusetts, 61 percent of folks have received at least one dose of the vaccine.
Hawaii has vaccinated 59 percent of its population with at least one dose, and New Hampshire, 58 percent. That’s the same with Connecticut, while Rhode Island rounds out the top six most partially vaccinated states with 55% of folks have gotten at least one dose.
What States Are Lagging?
The worst states for vaccine output are those in the south and midwest. Louisiana, Mississippi, Alabama, Georgia, South Carolina, Arkansas, Idaho, Indiana, and Wyoming all make up some of the worst vaccination rates, with only less than 40% of people having received their first dose.
CNN notes that the 22 states with the highest percentage of vaccinated people voted for Biden, and the 17 lowest vaccination rates all voted for Trump, with the exception of Georgia.
What Are the Most Vaccine Hesitant Groups in Each State?
Young people, Republicans, and those without a college degree are the most vaccine-hesitant, while states filled with older, whiter, more educated, and more left-leaning people have been the most successful at vaccinating people. Black and Hispanic people are being vaccinated at lower rates as well, and access (as well as misinformation) appears to be the main culprit.
And there’s also the simple fact that vaccine access hasn’t been completely equitable — which is why the Biden admin has begun to shift its focus to local clinics and pharmacies to distribute vaccines, which may help people in harder-to-reach areas get their COVID-19 immunizations, should they want it.
Biden’s plan has long been to get 70 percent of US adults to receive at least one dose of the vaccine by July 4. With 35 percent of Americans fully vaccinated, some 117 million people, the focus now will be on reaching out to those who aren’t yet vaccinated or haven’t even received one dose. Since 46 percent of Americans have received at least one dose, it’s an uphill battle to Independence Day.
This article was originally published on