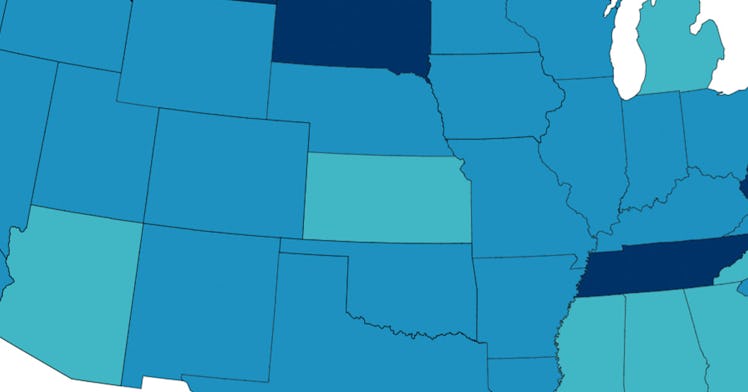
This Map Shows How Many COVID Vaccines Your State Has Given Out
South Dakota deserves a tip of the hat.

How many vaccines have your state given out? A new CDC tool will show you just how many.
The euphoria of seeing multiple COVID-19 vaccines approved for public use in record time has already faded as the rollout of those vaccines, actually getting them into people’s arms, has run headlong into incompetent politicians and a distrustful public. Instead of solving all of our problems, the vaccine rollout has created new ones. And just as data was critical in tracking the spread of the disease, it will be critical in tracking the spread of the vaccine.
The CDC just added vaccinations to its COVID-19 data tracker, making it easy for anyone to look up how many doses have been distributed and how many people have actually received the first dose. More specific numbers are available for long-term care facilities, where both patients and staff have priority. There’s also a map that shows, state-by-state, the total number of people initiating vaccination (i.e. receiving the first of two required doses) per 100,000.
So far, things don’t seem to be going great! Along with anecdotal reports of doses being given to passersby so they wouldn’t expire, the data, in the form of an interactive map tool, shows that as of 9:00 a.m. ET today, less than 30 percent of distributed doses have actually been distributed. That doesn’t seem great given that cases are spiking around the country and thousands of people are dying every day. The data is updated every few days.
So far, most states have initiated vaccinations between 1,001 and 2,000 people per 100,000. Those that are doing markedly better on that metric (over 2,000) tend to have smaller populations (e.g. Montana, the Dakotas, Alaska, Maine, Vermont, and Rhode Island). South Dakota is doing the best on this basis, with 3,042 people receiving the first dose per 100,000 residents.
The states that are lagging behind have initiated vaccinations for between 501 and 1,000 people per 100,000. Arizona, Michigan, Kansas, North Carolina, Georgia, Alabama, and Mississippi all belong in this ignominious category. It’s a race against the clock — but right now, the clock is winning.
For the most up-to-date information on the nationwide vaccine rollout, you can check the data tracker yourself.
This article was originally published on