Census Maps Reveal Just How Much America Is Changing
Your kids are growing up in a much different place than you did.

The Census Bureau released the first district-level results from last year’s decennial, constitutionally mandated survey of the United States. This data is most important as the basis for federal representation and redistricting, and it will have a huge effect on the midterm elections halfway through Joe Biden‘s first term. But beyond all that, it’s s the most thorough accounting we have of the various ways the American population has changed over the past decade.
There might not be many surprises in these findings, but that doesn’t mean that the changes it illuminates aren’t significant. Here’s how the United States has changed in the past ten years—and how it might continue to change until the next Census in 2030.
The United States Has Become Less White
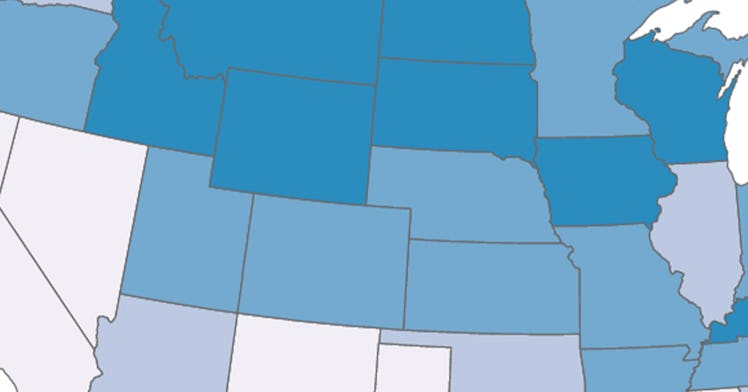
Compared to 2010, 8.6 percent fewer Americans identify solely as white. The white population increased in seven states, and the District of Columbia, and fell everywhere else, from a minuscule 0.2 percent dip in Colorado to a stunning 24 percent drop in California.
This is the first time the white population has ever dropped in absolute numbers. White people became a minority in six major metropolitan areas—Sacramento, New Orleans, Austin, Atlanta, Orlando, and Dallas-Fort Worth—portending what seems all but inevitable: White Americans becoming a minority.
Hispanic and Asian populations continue to grow rapidly—each has quadrupled in size in the past 40 years—while the growth of the white population has slowed with every census. It’s not that we’re losing white people, then, it’s that their population growth is nowhere near that of other groups.
census.gov
The United States is Less Rural
U.S. metropolitan areas are defined as “a core area containing a large population nucleus, together with adjacent communities that have a high degree of economic and social integration with that core.” In other words, cities and their nearby suburbs.
The population of U.S. metro areas increased by nine percent between 2010 and 2020, and the overall share of the U.S. population that lives in a metro area (as opposed to rural areas far from population centers) ticked up from 85 to 86 percent.
census.gov
The Population is Shifting South and West
The total population of the United States grew by 22,703,743 people, a 7.4 percent increase from 2010. The Northeast and Midwest came in under that overall rate, with 4.1 and 3.1 percent population growth, respectively. The South and West, on the other hand, exceeded it, with 10.2 and 9.2 percent growth, respectively.
census.gov
The Population is Aging
The 2020 Census found that the population of Americans over 18 years old grew by a substantial 10.1 percent over the last decade, to 258.3 million people. That translates to 77.9 percent of the total U.S. population, meaning that just 22.1 percent of Americans are minors.
It’s important to note that this data was collected at the outset of the pandemic, and given the disproportionate danger COVID-19 poses to older populations, it’s possible that the imbalance between minors and adults in the United States isn’t quite as drastic today as it was when these numbers were compiled.
Still, there’s a clear trend here, as the share of Americans under the age of 18 was 25.7 percent in 2000 and 24.0 percent in 2010.
census.gov