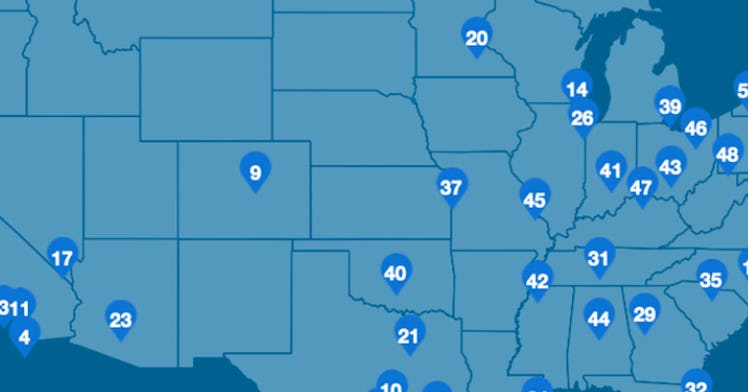
This Map Shows What Cities Have the Most Expensive Bills
If you want to save money on bills, avoid California at all costs.

A wise man once said, “More money, more problems.” But for most of us, the opposite is true, as having more money actually manages to solve many of the issues we have in our lives because existing in the modern world is quite expensive. And one thing that can really empty your wallet fast is bills — electricity, heat, WiFi, water, and whatever other expenses you have every dang month.
But it turns out where you live can have a big impact on how much your bills are costing you, which is why doxo decided to create a comprehensive list of the most and least expensive cities in America when it comes to paying bills.
T0 create the ranking, doxo compared the monthly bill expenses per household in the 50 largest cities in the United States and then compared that to the national average to find which cities were the most and least expensive when it comes to paying bills.
The monthly expenses included in the report — just so you don’t blow your head off with confusion as to how someone can be paying this much to survive — include average monthly spending in 10 “key household bill categories,” including mortgage, rent, auto loans, utilities, car insurance, cable, internet, and phone bills, health insurance, mobile phone bills, alarm and security bills, and life insurance, per doxo.
Doxo
It may not come as too much of a surprise that California has a strong presence in the top 10 most expensive cities, including San Jose grabbing the top spot with the average household paying $3,151 per month on bills (66.8 percent above the national average). (How is that possible!?) San Francisco was the second most expensive, while Los Angeles landed the no. 4 spot. San Diego and Riverside also made it into the top 10, giving the Golden State half the spots.
Top 10 Most Expensive Cities
- San Jose: $3,151 monthly bill expenses per household (66.8 percent above national average)
- San Francisco: $3,080 monthly bill expenses per household (63 percent above national average)
- Washington DC: $2,767 monthly bill expenses per household (46.5 percent above national average)
- Los Angeles: $2,753 monthly bill expenses per household (45.8 percent above national average)
- New York: $2,674 monthly bill expenses per household (41.5 percent above national average)
- San Diego: $2,668 monthly bill expenses per household (41.2 percent above national average)
- Boston: $2,663 monthly bill expenses per household (41 percent above national average)
- Seattle: $2,553 monthly bill expenses per household (35.2 percent above national average)
- Riverside: $2,330 monthly bill expenses per household (23.4 percent above national average)
- Denver: $2,328 monthly bill expenses per household (23.2 percent above national average)
On the flip side, if you are looking to get more bang for your buck when it comes to bills, your best bet is leaving the coastal life behind and heading to the south or midwest. Though, if you really want to stay on the East Coast, you could head to upstate New York, as Buffalo and Rochester both cracked the bottom five.
10 Least Expensive Cities
- Buffalo: $1,603 monthly bill expenses per household (15.1 percent below national average)
- Pittsburgh: $1,689 monthly bill expenses per household (10.6 percent below national average)
- Cleveland: $1,709 monthly bill expenses per household (9.5 percent below national average)
- Rochester: $1,711 monthly bill expenses per household (9.4 percent below national average)
- Louisville: $1,761 monthly bill expenses per household (6.8 percent below national average)
- St. Louis: $1,777 monthly bill expenses per household (5.9 percent above national average)
- Memphis: $1,778 monthly bill expenses per household (5.9 percent above national average)
- Cincinnati: $1,786 monthly bill expenses per household (5.5 percent below national average)
- Birmingham: $1,797 monthly bill expenses per household (4.9 percent below national average)
- Oklahoma City: $1,802 monthly bill expenses per household (4.6 percent below national average)
You can read the full report here.
This article was originally published on